
Your service delivery journey is not always linear and data can be use to inform your work while scoping the problem your services address, during service delivery, evaluation, and knowledge sharing.
As your organisation’s data maturity grows, the potential to further increase impact through data collaboration also grows.


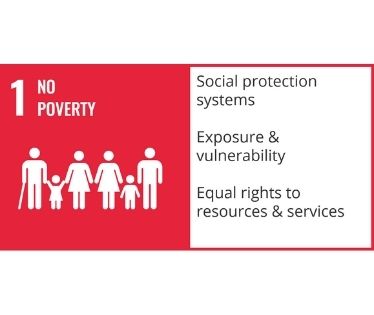
Problem Scoping
Open source data can be used to enhance the story and understand a given problem that a non-profit is addressing. These stories can establish the presence or absence of disparities in the quality of care or situation of a community and advocate for change about a certain issue or topic.
Here are some examples of how open data has been valuable during this project:


Program Delivery
Data standards are as simple as ensuring that we collect our information in the same categories as other service providers. This way, we are able to compare apples to apples when it comes to age categories, descriptions of common services, and so on.
Key Characteristics & Benefits of Data Standards
measurement and collection
surrounding outcome
measurement
reporting
measurement

Program Evaluation
Any data that an organization collects can be analyzed and aggregated data can be used to draw conclusions and tell stories. These stories can establish the presence or absence of disparities in the quality of care or situation of a community and advocate for change about a certain issue or topic.
Knowledge Sharing
Sharing data is the catalyst for data collaboration, beginning the process of seeking out data in the community to build a more robust story and seeing value in your organizations’ data story to share it with the community. Sharing can include bringing multiple sources of data together to tell a story from more service delivery perspectives, demonstrating a more impactful and detailed description of the issue or topic.

The Community Prosperity Hub has created a space for knowledge sharing and accessible data sharing for participating non-profits. Knowledge sharing through
data is the process in which we can begin to answer questions, like “Who is impacted by poverty in Fredericton”, with open source data alongside available community data.
In year two of this project, we will work towards non-profit data sharing with the NB-IRDT. Many government decisions will be made based on the research that comes out of NB-IRDT. It is very important that our non-profit data is included in these decisions, which can only be done through data sharing at this level.
Resources for data sharing initiatives:
Data Collaboration
Data collaboration brings multiple sources of data together to tell a story from more service delivery perspectives, demonstrating a more impactful and detailed description of the issue or topic.

capital of nonprofits

of services


Data collaboration is achieved through both phases of this project:

